
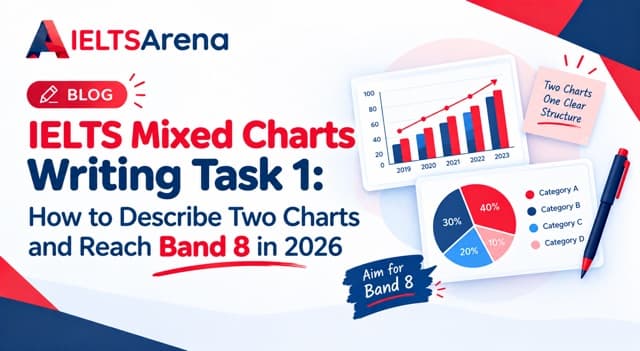
You open the Task 1 question and see two charts side by side. A bar chart on the left showing five categories. A pie chart on the right showing three segments. Your first instinct is to describe the bar chart in full, then the pie chart in full, then wrap up. Twenty minutes later you have 240 words that treat the question as two mini-tasks and never draw a single comparison between the charts. Task Achievement gets capped at Band 5 or 6 because the examiner is specifically looking for the connection you did not make. This is the mixed charts trap, and it catches candidates who prepared for single-chart questions and assumed two charts would just be twice the work.
Quick answer: IELTS mixed charts writing task 1 shows two charts (often of different types) in one question and asks you to describe them in 150 words minimum within 20 minutes. Use a four-paragraph structure: a one-sentence introduction naming both charts, a two-sentence overview that draws the connection between the two charts, one body paragraph covering the first chart's main features, and one body paragraph covering the second chart with explicit cross-chart comparisons. The single most common mistake is describing each chart separately with no linking sentence, which caps Task Achievement at Band 5 or 6 regardless of grammar and vocabulary.
What Mixed Charts Actually Test
A mixed charts question in IELTS Academic Writing Task 1 shows two visuals in a single prompt. The two charts almost always cover related but distinct information: a bar chart of overall spending alongside a pie chart of the breakdown of one category, a line graph of population change alongside a table of demographic composition, two line graphs comparing different metrics over the same period. The question expects one 150-word-plus response that treats both charts as one connected story.
The skill this format tests is synthesis. A single chart tests description. A mixed charts question tests whether you can select the most significant feature from each chart and then explain how the two pictures fit together. This is what candidates most often miss. They approach the question as two separate 75-word descriptions and never make the link that would push their Task Achievement from Band 6 to Band 7.
Task Achievement, one of the four Task 1 assessment criteria weighted at 25 percent each, specifically checks whether you covered every key feature and drew comparisons where relevant. On a mixed charts question, "where relevant" nearly always means between the two charts, not just within each one. Coherence and Cohesion checks whether your response reads as one connected essay rather than two stitched-together halves. Getting the connection right is what separates a Band 5 or 6 mixed charts response from a Band 7 or 8.
Advertisement
The Chart Pairings You Are Most Likely to See
Mixed charts questions appear in a handful of predictable combinations. Knowing the pairings in advance saves planning time on test day:
Bar chart plus pie chart. The bar chart usually shows a total or a comparison across categories. The pie chart usually breaks down one of those categories into its parts. Your job is to describe both and explain how the pie chart's breakdown fits inside the bar chart's totals.
Line graph plus table. The line graph usually shows change over time. The table usually shows the categories driving that change. Your job is to describe the trend from the line graph and then explain which categories in the table account for the biggest share of the change.
Two line graphs. Both graphs cover the same time period but different metrics (for example, population and income). Your job is to describe each trend and then explain whether the two trends move together, move apart, or are unrelated.
Two pie charts. Covered in the pie chart guide, but the principle is the same: describe each chart's dominant category and then compare how the proportions shift between them.
Bar chart plus table. The bar chart usually shows a summary metric. The table shows the underlying data. Your job is to describe the bar chart's main features and use the table to add specific detail where it strengthens the comparison.
How Mixed Charts Compare to Every Other Task 1 Chart Type
Understanding what makes mixed charts different from single-chart questions is the fastest way to fix a low Task Achievement score.
| Chart Type | Number of Visuals | Main Skill Tested | Common Trap |
|---|---|---|---|
| Line graph | 1 | Describing changes over time | Listing every data point |
| Bar chart | 1 | Comparing values across categories | Describing bars left to right |
| Pie chart | 1 | Grouping segments and comparing shares | Listing every percentage |
| Table | 1 | Cross-dimensional selection | Reading row by row |
| Mixed charts | 2 | Cross-chart synthesis | Describing each chart separately with no link |
| Process diagram / map | 1 | Sequential or spatial description | Treating like a data chart |
Notice what makes mixed charts unique: the difficulty is not in describing either chart on its own. Both individual charts are usually simpler than a full single-chart question. The difficulty is in seeing the story the two charts tell together, and in structuring your 150 to 190 words so that the connection is visible from the overview onward.
If you have already reviewed the bar chart guide, the line graph guide, the pie chart guide, the table guide, and the process diagram and map guide, mixed charts are the last major Task 1 format and the one most candidates encounter without preparing for specifically.
Why Common Approaches Fail
Three specific mistakes account for most low Task Achievement scores on mixed charts questions. Each carries a predictable mark loss.
Mistake 1: Describing each chart separately with no linking sentence. Candidates write one full paragraph on chart A and one full paragraph on chart B, treating the question as two unrelated tasks. The response reads as two stitched-together halves and has no synthesis. Task Achievement is capped at Band 6, sometimes Band 5, because the examiner sees no comparison between the two visuals. This is the single most common cause of sub-Band 7 mixed charts responses.
Mistake 2: Writing an overview about only one chart. Candidates write an overview naming the main feature of the first chart and skip the second chart entirely, or vice versa. The overview should cover both charts and, ideally, name the connection between them. A single-chart overview on a two-chart question is treated by the examiner as a partial overview, which drops Task Achievement by half a band to a full band.
Mistake 3: Wasting time on equal-depth description. Candidates try to describe every feature of both charts equally and run out of time or exceed the word limit. Not every feature of both charts deserves equal attention. The examiner rewards selection, and on mixed charts questions, that means picking the two or three features from each chart that support the cross-chart story, not covering every bar and every slice.
A Real Student's Story: Band 5.5 to Band 7.0 in Five Weeks
Mateus, a civil engineer from Sao Paulo applying for a skilled migration visa to Australia, kept scoring Band 5.5 in Writing despite hitting Band 7.5 in Speaking. He reviewed his last four Task 1 attempts. His bar chart and pie chart responses came back at Band 6.5. His two mixed charts attempts came back at Band 5.5 and Band 6.0.
I would describe the first chart, then start a new paragraph and describe the second chart. It never crossed my mind that the examiner was waiting for me to say how the two charts connected. My teacher called it 'writing two essays instead of one.'
He restructured his approach around one rule: before writing anything, identify one sentence that explains how the two charts relate. That sentence became the second sentence of his overview. On his next mixed charts attempt, Task Achievement moved from Band 5.5 to Band 7 with no change to his vocabulary or grammar. His overall Writing lifted from Band 5.5 to Band 7.0 in five weeks, driven almost entirely by fixing this one question type.
The Data Behind This Question Type
Cambridge Assessment English reports that Task Achievement accounts for the largest single share of missed marks on Academic Task 1 in the Band 5 to Band 6.5 range, and mixed charts questions produce a disproportionate share of those losses because the two-chart format specifically requires cross-chart comparison that candidates preparing for single-chart questions do not practise (Cambridge Assessment English, IELTS Test Statistics 2024 to 2025).
British Council examiner reports specifically flag the absence of comparison between the two visuals as one of the most common single-mistake causes of a capped Task Achievement score on mixed charts. IELTS.org confirms the four Task 1 assessment criteria for 2026 remain Task Achievement, Coherence and Cohesion, Lexical Resource, and Grammatical Range and Accuracy, each weighted equally, with the same overview and comparison requirements applied across every Task 1 format including mixed charts (IELTS.org, 2026 assessment framework).
Internal tracking on IELTSArena shows that roughly eight in ten mixed charts submissions in the Band 5 to Band 6 range describe each chart separately with no linking sentence between the two body paragraphs. The same tracking shows that candidates who write one explicit cross-chart comparison sentence in the overview score half a band to a full band higher on Task Achievement, on average, than candidates who do not.
The Right Approach: A Four-Paragraph Structure
Use this structure every time you see two charts in one Task 1 question.
Paragraph 1: Introduction (1 to 2 sentences, 25 to 35 words). Paraphrase the question. Name both charts explicitly: what each one shows, the categories involved, the time period, and the unit of measurement. The introduction is not the place to describe data or draw comparisons.
Paragraph 2: Overview (2 to 3 sentences, 35 to 55 words). State the biggest feature of each chart. In the second or third sentence, state the connection between the two charts explicitly. This is the non-negotiable sentence on a mixed charts response. Without it, Task Achievement is capped at Band 6.
Paragraph 3: Body paragraph one (50 to 70 words). Describe the first chart's main features with specific figures. Focus on the two or three features that connect to the story of the second chart, not on every data point.
Paragraph 4: Body paragraph two (50 to 70 words). Describe the second chart with specific figures and, critically, at least one explicit comparison back to the first chart. Do not treat this paragraph as an independent description.
Total target for an IELTS mixed charts writing task 1 response: 170 to 200 words in 20 minutes. Writing at 150 leaves no margin for the cross-chart comparison. Writing beyond 220 usually means you are describing every feature of both charts equally.
A 2-minute planning routine prevents most Task Achievement losses on mixed charts: identify the main feature of chart A, identify the main feature of chart B, then write one sentence that connects them. Do this before writing a single word of the introduction.
Sample Prompt with Band 8 Model Answer: Bar Chart Plus Pie Chart
Prompt: "The bar chart below shows total household energy consumption in five European countries in 2024. The pie chart shows the breakdown of energy use inside the average German household in the same year. Summarise the information by selecting and reporting the main features, and make comparisons where relevant."
Bar chart totals in kWh per year: Germany 4,800; France 4,200; Spain 3,600; Italy 3,900; Netherlands 3,300. Pie chart of German household breakdown: Heating 52%, Hot water 18%, Appliances 14%, Lighting 8%, Other 8%.
Model response (192 words):
The bar chart compares average household energy consumption in five European countries in 2024, while the pie chart breaks down how the average German household used its energy in the same year.
Overall, Germany recorded the highest household energy consumption of the five countries, and the pie chart shows why: heating alone accounted for more than half of German household use. Netherlands recorded the lowest total, roughly 30 percent below Germany.
The bar chart shows that German households consumed 4,800 kWh on average, followed by France at 4,200 kWh and Italy at 3,900 kWh. Spain, at 3,600 kWh, and the Netherlands, at 3,300 kWh, sat at the lower end. The gap between the highest and lowest countries was 1,500 kWh, roughly a third of the German total.
Inside the average German household, heating dominated at 52 percent, more than double the combined share of appliances and lighting at 22 percent. Hot water accounted for a further 18 percent, meaning heat-related demand explained 70 percent of overall consumption. This helps explain why Germany, with its colder climate, sat at the top of the bar chart totals.
This response succeeds because the overview names both charts and connects them, the first body paragraph describes the bar chart with a summary comparison, and the second body paragraph describes the pie chart while explicitly referring back to the bar chart totals. Task Achievement, Coherence and Cohesion, Lexical Resource, and Grammatical Range and Accuracy would all sit at Band 8 for this length and quality.
Sample Prompt with Band 8 Model Answer: Line Graph Plus Table
Prompt: "The line graph below shows the total number of international students studying in Canada from 2000 to 2020. The table shows the top five countries of origin of those students in 2020. Summarise the information by selecting and reporting the main features, and make comparisons where relevant."
Line graph values: 2000: 130,000; 2010: 220,000; 2020: 540,000. Table of 2020 origin countries: India 210,000; China 110,000; Vietnam 45,000; South Korea 30,000; Nigeria 25,000. All other countries combined: 120,000.
Model response (186 words):
The line graph illustrates the total number of international students in Canada between 2000 and 2020, while the table shows the top five countries of origin for those students in the final year of the period.
Overall, international student numbers in Canada rose sharply across the two decades, more than quadrupling by 2020. The table reveals that this growth was concentrated in a small number of source countries, with two nations accounting for the majority of the total.
The line graph shows enrolment rising from 130,000 in 2000 to 220,000 in 2010, a moderate increase, and then climbing sharply to 540,000 by 2020. The steepest growth occurred in the second decade, when the total more than doubled in ten years.
The table explains where this surge came from. In 2020, students from the top two countries made up nearly 60 percent of the total, with 210,000 students from the first origin country and 110,000 from the second. Together with Vietnam, South Korea, and Nigeria, the top five countries accounted for 78 percent of all international students, showing how narrowly concentrated the source pool had become.
This response works because the overview explicitly links the two charts (the growth in the line graph is explained by the concentration in the table), the first body paragraph reports the trend without over-listing years, and the second body paragraph explicitly refers back to the total from the line graph while introducing the table's data. This cross-reference is what pushes Task Achievement into Band 8 territory.
Vocabulary for Linking Two Charts
Mixed charts responses reward precise linking language that signals to the examiner you are treating the two charts as one connected story.
For connecting the charts in the overview: "the pie chart explains why", "this trend is driven by", "the table reveals the source of the change shown in the line graph", "these two charts together suggest".
For back-references in body paragraph two: "as shown in the previous chart", "this compares to the total reported earlier", "returning to the bar chart", "this figure represents X percent of the total shown in the line graph".
For synthesis in the closing sentence: "taken together, the two charts show", "the combined picture is", "the trend and the breakdown together suggest".
Avoid: "the first chart shows... the second chart shows...". This structure signals to the examiner that you are treating the two charts as unrelated, which is exactly the mistake the format is testing for.
How IELTSArena Helps You Practise This Specifically
IELTSArena's Task 1 question library includes a dedicated mixed charts practice set alongside separate sets for line graphs, bar charts, pie charts, tables, process diagrams, and maps, so you can drill this specific format rather than encountering it for the first time on exam day. Every submission is scored against Task Achievement, Coherence and Cohesion, Lexical Resource, and Grammatical Range and Accuracy separately, so if your response is losing marks because it lacks the cross-chart comparison sentence, the feedback names it directly rather than leaving you to guess.
Expert tutors on IELTSArena review mixed charts responses with a specific focus on the two most common gaps: the missing linking sentence in the overview and the missing back-reference in the second body paragraph. The platform also replicates the real IELTS CBT interface, including the 20-minute timer for Task 1 and the on-screen word counter, so your practice sessions match the exact conditions you will face on exam day. More than 10,000 students have used IELTSArena to reach their target band, with Writing being the section where per-criterion feedback produces the fastest visible improvement.
Start your free IELTS practice on IELTSArena and try a timed mixed charts response this week.
Self-Diagnosis: Are You Ready for an IELTS Mixed Charts Prompt?
Work through these questions honestly before your next practice session.
When you look at a mixed charts question, can you write one sentence explaining how the two charts connect, before you start writing the introduction? Does your overview cover both charts, or does it focus on only one? Do you draw at least one explicit cross-chart comparison in body paragraph two? Are you avoiding the "chart A shows this, chart B shows that" structure that signals treating them as unrelated? Do you select two or three features from each chart based on the cross-chart story, or do you try to cover every feature equally? Have you timed yourself writing a full mixed charts response in 20 minutes, start to finish, in the last two weeks?
If you hesitated on more than two of these, cross-chart synthesis is the specific gap costing you Task Achievement marks, and it is the fastest structural fix on any Task 1 format.
Key Takeaways
- IELTS mixed charts writing task 1 tests cross-chart synthesis, not two independent descriptions.
- Use the four-paragraph structure: 1-sentence introduction naming both charts, 2-to-3-sentence overview drawing the connection, two body paragraphs each 50 to 70 words. Total target 170 to 200 words.
- The linking sentence in the overview is non-negotiable. Its absence caps Task Achievement at Band 6.
- Body paragraph two must contain at least one explicit back-reference to the first chart.
- Select two or three features from each chart based on the cross-chart story, not on every data point.
- Plan for 2 minutes: identify main feature of chart A, main feature of chart B, and the one sentence connecting them.
Related Guides on IELTSArena
- IELTS Bar Chart Writing Task 1: Band 8 Guide
- IELTS Line Graph Writing Task 1: Band 8 Guide
- IELTS Pie Chart Writing Task 1: Band 8 Guide
- IELTS Table Writing Task 1: Band 8 Guide
- IELTS Process Diagram and Map Writing Task 1
- IELTS Writing Band Score Explained
See Where Your Task 1 Band Stands Today
Try a free mock test at ieltsarena.com and see your band score in minutes. In one free timed mixed charts response, you will know exactly where your Task Achievement score stands today, and whether cross-chart synthesis is the gap holding your Task 1 band back.
Start your free IELTS practice on IELTSArena
Frequently Asked Questions
How do I describe two charts in IELTS writing task 1? Treat the two charts as one connected story, not two separate descriptions. Start with a one-sentence introduction naming both charts and what each one shows. Follow with a two-to-three-sentence overview that states the biggest feature of each chart and, critically, one sentence explaining how the two charts connect. Write one body paragraph describing the first chart's key features with specific figures, then a second body paragraph describing the second chart with at least one explicit back-reference to the first. Aim for 170 to 200 words in 20 minutes. The linking sentence in the overview is what separates a Band 7 mixed charts response from a Band 5 or 6 one, regardless of your grammar and vocabulary elsewhere.
What is the best structure for a mixed charts response in IELTS? The best structure is four paragraphs: introduction, overview with a linking sentence, body paragraph one on chart A, body paragraph two on chart B with cross-references. The introduction paraphrases the question and names both charts. The overview covers the main feature of each chart plus an explicit connection sentence between them. The two body paragraphs report specific figures, with the second paragraph including at least one back-reference to the first chart's data. This structure matches what examiners are trained to look for on Task Achievement and Coherence and Cohesion, and it is the specific requirement that mixed charts questions add on top of the standard single-chart structure.
Should I compare the two charts in the overview or in the body paragraphs? Both, but the overview is where the connection is non-negotiable. The overview must contain at least one sentence that explicitly links the two charts, and it should name the biggest feature of each. In the body paragraphs, chart A's paragraph can stand more or less independently, but chart B's paragraph must contain at least one back-reference to chart A's data. This ensures the response reads as one connected essay throughout, not as two stitched-together halves. Missing the overview link is the most common single-mistake cause of a capped Task Achievement score on mixed charts questions, more common than any vocabulary or grammar error.
Why did I lose marks on my IELTS mixed charts task 1 even though my English was strong? The most common reason is Task Achievement, not language quality. If you described each chart in a separate paragraph with no linking sentence in the overview and no back-reference in body paragraph two, Task Achievement gets capped at Band 6 regardless of your Lexical Resource and Grammatical Range scores. Task Achievement is 25 percent of your Task 1 band, so a cap here pulls your overall Task 1 score down by half a band to a full band. The fix is structural: add one linking sentence to the overview and one back-reference to body paragraph two. This typically produces a visible band-score gain within one or two practice sessions.
Are mixed charts harder than a single chart in IELTS? Mixed charts are not inherently harder to describe, but they are harder to score well on because candidates prepared for single-chart questions rarely practise the specific synthesis skill they test. Each individual chart in a mixed charts question is usually simpler than a full standalone chart, so the raw description is easier. The difficulty is in the linking, which is the specific skill this format tests. Candidates who understand this and prepare the connecting sentence in advance often find mixed charts easier to score Band 7 on than a complex single line graph or table, because the format rewards a structural discipline rather than heavy data description.
Last updated September 2026 by the IELTSArena Editorial Team, a team of IELTS tutors, certified CBT examiners, and Writing feedback specialists who publish weekly research-backed guides on ieltsarena.com.